
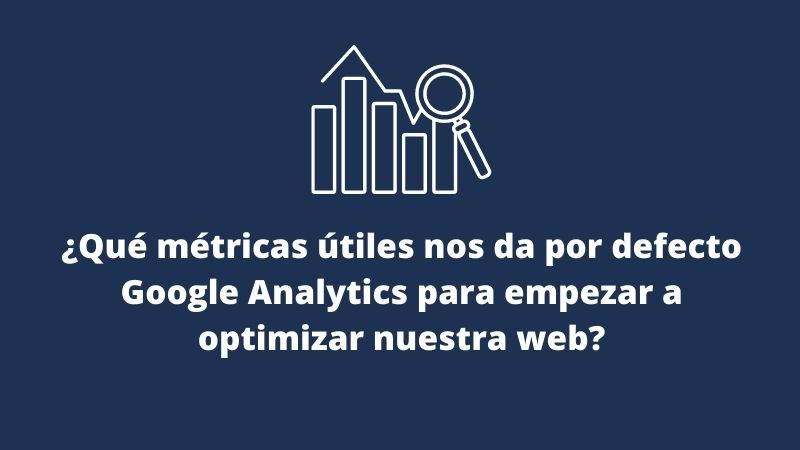

What useful metrics does Google Analytics give us by default?
Having Google Analytics implemented in our online store is almost mandatory since it will be the way to collect essential information to propose marketing strategies.
We will be able to see who visits us, where they do it from, if our paid campaigns are working correctly, if there are problems on our website that make the user back out.
Google Analytics is a tool that stores data and collects it using cookies. With cookies we can track the user who browses our website and recognize if they return to our store at another time.
All the information it stores is expressed in numerical values and in metric forms. However, many times simply reading the metrics does not provide much value. The interesting thing about data or what adds value is knowing how to analyze it, understand it and cross-reference it to obtain results that can enhance the improvement of the store. That's the job a data analyst faces.
However, in this post we are going to see what the main metrics are that we will look at and we will also see the interpretation we can give them.
Main Google Analytics metrics
To begin, let's look at the main Google metrics. These are going to be the ones we find in most reports.
In the acquisition column:
- Users. Users who have started at least one session.
- New users. Number of new users.
- Sessions. The period in which a user interacts with the website.

For example, in Google Ads reports we can find the following:
- Clicks. The number of clicks the website's urls have received from search results.
- Cost. The total that has been paid for the clicks received on the ads.
- CPC. It is the average cost paid for each click that ads receive in search results.
In the Search console report we can find
- CTR. This metric tells us the percentage of clicks that are occurring based on impressions.
- Impressions. Number of times a url from your site has appeared in search results.
For the behavior column
- Bounce Rate. It is the percentage of sessions that do not go beyond the first page and where the user has not made any interaction.
- pages/session. Represents the average number of pages viewed per session.
- Average session duration.

In the Conversions column, the metrics that will appear depend on the objectives that we have set or if we have activated e-commerce. Since the metrics will vary for one or the other and in the column we will find a drop-down menu where we can choose the metrics.
If we choose e-commerce:
- Transactions. Number of sales made
- Income. Shows total revenue earned through e-commerce or in-app purchases.
- Conversion rate. It is the percentage of sessions that have generated a conversion

For the objectives:
- Objective achievements. It will be the number of conversions related to the objective.
- Target value. Monetary value assigned to the fulfillment of the objective.
- Target conversion rate. Percentage of visits that have met the objective.


Let's remember that implementing the Google Analytics code is not enough to start collecting data and analyzing it. Deploying the code is just the beginning. We have to configure the platform so that the data we collect is of quality.For this reason, we recommend the post on 5 essential filters to implement in Google Analytics .
Now that we have seen what the most common metrics are that we can find in our Google Analytics platform, we are going to put them in context and interpret them. We will see examples of possible questions that we can answer with metrics.
How can I know how many people visit my online store on certain dates?
One of the things that Google Analytics allows us to do is limit the visualization of data by the dates that we indicate, whether it be a week ago, a month, a year... The limits are, from the day before the current one to the date of implementation of Google Analytics to the online store.

So once we have selected the dates where we want to do our analysis. We will go to the audience report, then in an overview we can see the total number of users who visited our website and even how many of them are new users.

How many of the new users in all of our traffic were men?
In this case, after selecting the dates for which we want to see this information, we would go to the audience report>Demographic groups>sex and in the acquisition column we see the metric for new users and we would analyze the one that corresponds to men.

And if for this segment we want to know how much is the average time they spend per session.
We simply look at the Average Session Duration metric in the Behavior column.
Where is my traffic coming from?
We would go to the Acquisition>All Traffic>Source/Medium report. In this table we see the sources from which the user accesses our website, the number of users accessing each source, how many new users each source attracts, the quality of users each source attracts measured by the bounce %.

What landing page do our users access?
We would go to the Behavior>Site Content>Landing Page report. Here we can see a list of the pages through which users have accessed our site. In general it is always home. However, it is always advisable to review the data in case something is working the way we don't want.

